
Smart Data
It’s not Skynet, but our Data will become self-aware
We have all witnessed the speed at which data analytics has taken over the conversation in business, sports, and even our health. The only problem is that data can’t be trusted – or more correctly put, the people flying the tools that analyze and present the data all have opinions that tend to creep into objective reports. Data has always been passive, disconnected, cold, and too easy manipulated by mistake or intention. No more.
Instead of continuing to treat our most precious modern-day commodity as though it was dumb as a rock, it is finally time to inject some intelligence into the data itself. By adding AI at the source, we not only protect the integrity of the data from misuse, but we also enable the ability for us to see it in new ways we hadn’t considered before. All it takes is inserting Machine Learning into the mix along with some clever presentation tech to give it a sense of life. Spatial Computing engines were designed to allow for the fast construction and recombination of elements, a set of attributes from its game engine lineage. It’s suits this task perfectly.

The day is coming when our artifacts are self-aware enough to fret
Self-Awareness
Let’s consider how data can be enhanced with AI to provide some degree of proactive behavior to increase its usefulness. Perhaps data is like a small child who begins to learn it can start to do things for itself, without someone else’s help. One step at a time, it starts to explore and see what’s possible within its limits. There are missteps and tears, but over time the child learns what’s possible. And in the process, they become self-aware – realizing a bit more about their capabilities, strengths, and weaknesses.
Rather than data being used as the basis for analysis, charting, and research, we need to invert the model to make data the self-aware driver instead of the passive passenger (where appropriate). Reversing data’s role in the equation to be more self-aware and curious starts to treat it the same as any other piece of Smart Information. Potential performance and overhead issues aside, there’s no reason why data sets shouldn’t proactively be doing their own analysis or verification. Imagine each individual data point being able to protect its own integrity from attack or unauthorized use (rather than the insecure systems we build as fortresses around it today). Let’s pause there for a moment and let that sink in.
Data is no longer static. It’s alive.
“Smart Data” could monitor its own creation process, access requests, transit, replication, and manipulation – something we could only do at a much higher level of construct before now. The compelling reason to do this is trust. Above all, we need to believe that the data we are relying on to make critical decisions, conduct business, and govern gazillions of monetary transactions needs to be trustworthy and verifiable. In a world where data transactions are happening faster and faster with no human oversight, and in an incomprehensible quantity every second of every day, putting security and integrity closer to the data source is imperative.

The Blockchain gold rush is on, but is it the right security for data?
As crazy as all this may sound, we are already doing it for other high risk, high reward data scenarios. The fast growing Blockchain technologies used for securing financial and authoritative transactions are doing something very similar by protecting the integrity of its individual “blocks” via a distributed system of checks and balances across a network. Devised so that no one instance can be compromised without detection, Blockchain is taking the crypto market by storm, and continues to grow. By essentially putting a wrapper around each block of data, watching out for it, processing requests and attending to its needs, the system functions as an interesting model to consider. Given that example, think about how any piece of data, data set, or data center could also be encapsulated in a similar way and employ its own self-aware but coordinated efforts to stay secure and verified.
I’m not saying Blockchain tech should be used for all Smart Information implementations (necessarily), but we should learn from this area of investment and focused effort. Encapsulation of code objects is not new at all in programming circles, but inverting the model to have the object being encased driving the bus is a whole new world for data.
Conditional Access
Using curious and capable data as a backdrop, let’s look at how a new kind of behavior and exploration could play out for secure information repositories.
We are constantly being challenged to identify ourselves to access every secure website or service in our lives. We are asked for credentials over and over, sometimes being spared by saved passwords, but more often than not being asked to use two factor authentication (i.e. our phones) to verify our identity. Is that bad? No, of course not. That’s all needed and appreciated from a security standard, but honestly a pretty crappy experience from the human standpoint. As distasteful as that reality may be, it’s not the biggest problem.
The real issue is that we have been protecting things at the wrong level. It’s all or nothing. That usually means the whole site, which severely limits the kind of interactions and experiences that can be designed for that situation. Same exact situation for data. Almost all data is protected at the “collection” level, meaning a data set, database, feed, graphic, document, or service. All or nothing. No credentials, no data. Again, nothing wrong with that for some applications, but it is also something we can invert by injecting some self-awareness into the data itself. By being able to handle access requests and decide for itself what and how much it will share with whom for the current context, data is self-aware.
The ability to access data in this more granular way leads us to consider a big shift in how we think about doing collaboration and discovery. If data really was empowered and given the opportunity to explore and discover what’s possible for itself, would we treat it just like that curious child we can’t seem to bring ourselves to let go of? Isn’t it time to stop holding everything hostage within secured sites or documents when only a few things actually need to be restricted. Think about it.
Once we push the responsibility of securing oneself all the way down into Information Objects themselves, they can exist side-by-side with other data objects that are completely unprotected or conditionally secured. That’s essentially how our post-modern information ecosystems need to be built up – data sets wrapped by curious pieces of Smart Information.
Shape Dynamics
Data is worthless without context and comparison. It also needs to be put into a familiar shape that makes it easier to understand. That can be the numeric form for datapoints, charts and graphs for sales data, or familiar onscreen graphics for sports fans. Our minds arrange data according to our mental models of what it represents or the shape most familiar to us when dealing with it in the past. The shape that data takes is critical to its value. In the wrong form, it might as well be a foreign language we don’t understand. But, in the right shape its value is immediate.
Smart Data objects have the ability to choose for themselves what shape to take given the current context. In many ways, that is exactly what we as Designers and Data Scientists do with data. It gets poured into shape containers like bars, pies, scatter plots, and the ever popular circular chart of doom (a great example of beauty before clarity). The shape our data is presented in says a ton about how its preparer wants us to consume it – using a particular kind of visualization brings meaning with it. We have associated the shape with the message. And that is precisely where Smart Data excels. It knows how to tell its own story (like any other piece of Smart Information) and can utilize any shape and form to achieve clarity for the viewer. That’s new. Today’s data is static and lifeless. What we’re saying now is that data can re-flow itself into any shape that will help it convey its meaning or message for the current situation and audience.
Yes, what you just heard was the sound of a million Data Scientists scoffing. But, rest assured, the introduction of Artificial Intelligence to assist with presenting the data in the right way will change everything about Data Science and Data Visualization. What was considered an elite skill, and by some a black art, Data Visualization will be aided by AI to help choose the right shape for information based on its Machine Learning insights from doing this over and over, multiplied by the network effect. So much effort is spent today to pick the “right” shape of data only for it to be so wrong for the given audience. This is one of those cases where learning AI systems can eliminate difficult work.
Living Systems
Data, like life, can be thought of as a colossal, living, breathing system of interconnected experiences. We too often tend to look at data points or data sets in isolation, as if they came from nowhere, unconnected, silent, and alone. Nothing could be further from the truth. Every single piece of data that has ever been generated or consumed in the history of everything has come from a living system. It could be the company’s monthly sales cycle, the planet’s global warming, or your own medical tests. Regardless, every data point is connected and part of a very large set of other points that are not standing still in any way. Everything moves and changes. Data is a snapshot of that movement at a particular time. And so it stands to reason that we are wrongheaded to keep looking at data statically, with no hint of the motion inherent in the system it came from. True, a single data point is a perfect snapshot in time – but that’s the point. It came from a continuum that is in motion.

Information space are vast interactive pools of active text elements
We tend to not see the larger systems at work around us in the world. They are invisible, sometimes operating at mind-boggling speeds, and exist in a different plane – the invisible. With Smart Information, we can finally visualize and interact with these vast invisible data systems. Just as with Object-Oriented code classes, Smart Data objects understand the connection to their “parent” object and to the larger data set, stream, or original source. That gives us the hook to walk back up the connection path and explore these larger systems.
The true breakthrough here is not the stunningly beautiful renderings of these data systems, but rather the insights derived from using Machine Learning to spot the patterns in these living systems. The animations and motion of the visualizations reveal plenty about the nature, behavior, and performance of the systems, but they are nothing compared to the deep analysis possible with AI.
Smart Data Examples
Here are a few example scenarios using Smart Data to accomplish more than we can today.
Data Blade
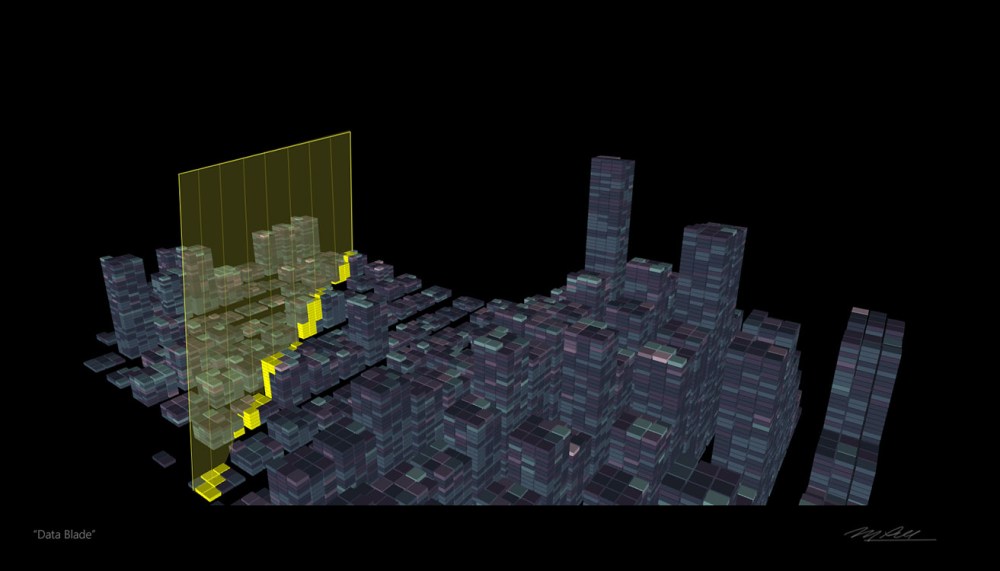
When exploring or analyzing data sets, the fastest way to scrub through the various variables and dimensions is by using a “data blade”. These are shown as visual planes in 3D, but are really just a UI mechanism for moving through the values of a dimension or variable quickly. The changes in value readout in real-time as the blade is passed through the data set . These data blades are built-in parts of any Smart Data object to invite quick explorations of the values and what-if scenarios
Datacenter

Data will become self-aware and self-organizing, which means it will gravitate toward other similar types of data or situations where there are like-minded data sets. These mirror-world repositories are called datacenters, much like their physical building equivalents. These digital datacenters do the same type of management and maintenance of their data tenants as the real-world equivalent.
Multi-Dimensional Data
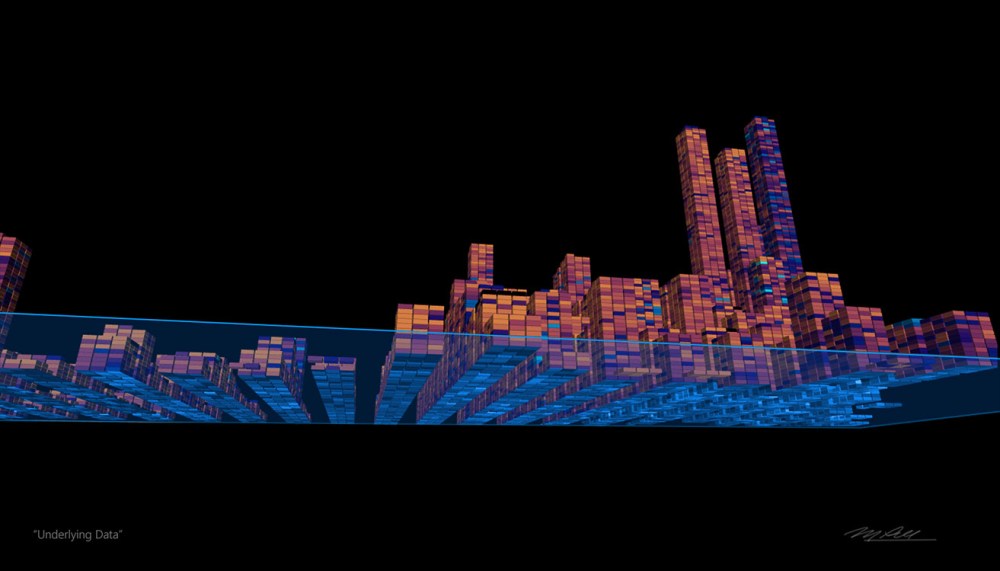
Combining the data blade and datacenter, this example is illustrating how you can isolate particular datasets and examine them from any angle. In this particular example, the data is from the 2010 US Census, filtered to show aspects of income and education level. The interaction of note is the ability to see underneath the surface level data to where you suspect something not quite right. Exploration is quick, but analysis is tedious as other methods.
Geoshaping Data
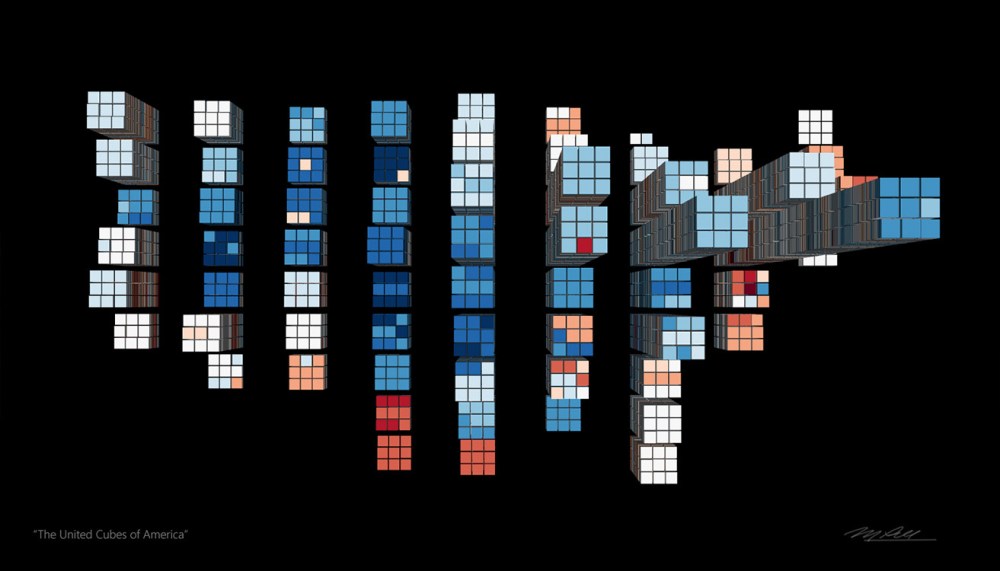
Maps and geospatial relationships are one of the easiest ways for people to recognize and consume data. Putting datasets into maps and map-like constructs is a great way to create the sense of familiarity that people desire. This particular example plots income and education onto a map of the USA. Higher piles indicate more of the desired variable.
Being able to self -organize into these familiar geo shapes helps the Smart Data be recognized and explored.
Data Towers

There’s a similarity between walking through New York City while seeing the massive towering skyscrapers and engaging in a virtual tour of your data sets within Virtual Reality or Mixed Reality. The key experience aspect with this is the scale and sense of perspective that these so-called Data Towers bring. It’s hard to undersell the positive impression and sense of familiarity when exploring data in this form.
Not for every application, Data Towers can be useful when a sense of huge scale is useful in engaging people who are exploring. This data shape is one of the best for initial exploration
.
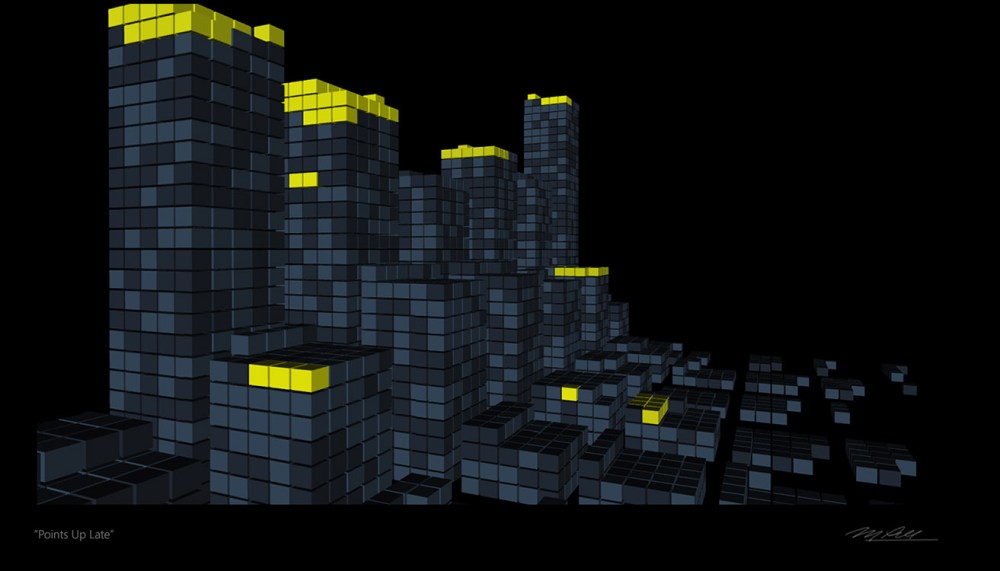
Data Outliers

There are frequently “outliers” in datasets – values or datapoints that seem to be out of bounds or unexpected for some reason. These are typically hidden within large datasets, sometimes never coming to light. They are hard to spot. With Smart Data shaping, we can elevate these outliers to be easy to spot visually or in analysis.
In this particular example, the outlier occupies the penthouse of a data tower, showing off its specialness with a brightly lit space.
Learning Data
One of the key differentiators with Smart Data its ability to learn in the background, instead of just sitting doing nothing. Individual datapoints or entire datasets can use their AIs to run jobs where new insights are explored or related items tagged and associated.
In this example, the datapoints that are actively learning are shown brightly colored.
Data Fog

As Charlie Fink likes to say, “the world will be painted with data” – or in this example, the world will be permeated by a Data Fog. Drifting into and out of most everything, Smart Data can take a physical form like this to illustrate mood or surface emotion. The effect itself can either be made of data or just a visual special effect to augment the presentation of other data.
In the above scene, the buildings in the background are actually Datascrapers themselves. The Data Fog is an additional layer of values that work with the base dataset.
Data Storm

When too much data is accessed by or injected into a database at one time, it’s a scenario referred to as a Data Storm. The incoming data may or may not be captured properly by the accessor. Visual cues are present when this condition exists, such as a violent weather look and storm characteristics such as blowing wind, rain, or dark threatening skies while the situation continues.
Data Bridge

Connecting different types of data sets and making them presentable is one of the talents of Smart Data. This is done by building bridges between the databases or datasets and exchanging elements as needed. The bridges are dynamic, so you can see them being deployed across voids or bodies of water.
In the example, the city in the distance at the end of the Data Bridge is actually comprised of hundreds of Datascrapers.
We are still a long way from Skynet becoming self aware, but we are not far at all from our data having its own intelligence.
M. Pell
Chapter 6 from “The Age of Smart Information”
Copyright © 2019 Mike Pell – Futuristic Design, Inc. All rights reserved

BOOK AVAILABLE NOW FROM

Learn more about the author M. Pell at Futuristic.com
or follow on Twitter at 
CONNECT WITH M. PELL


Copyright © 2019 Mike Pell – Futuristic Design, Inc. All rights reserved
